Enphase System Monitoring
• Analysing Energy Monitoring Data •
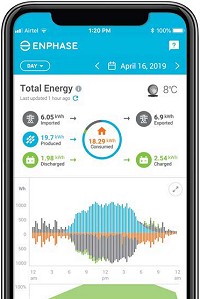
A solar power system with Enphase microinverters has many benefits, one of which is the detailed monitoring data available for analysis.
 SolarWise Wagga offers a complimentary analysis service designed to assist you in decision making and getting the most benefit from your system.
Enphase system monitoring data analysis can be used to:
○ identify ways to further increase the benefit from solar
○ choose the most effective energy plan and tariff option
○ assess battery feasibility and suitable storage capacity
This document aims to show the extent of information available and to explain the outputs generated by the analysis to assist you in getting the most out of your installation.
The charts shown in this article are from an Excel spreadsheet that was created
with raw system data from the Enphase monitoring platform report feature.
1. Monthly Average Daily Input and Output Analysis
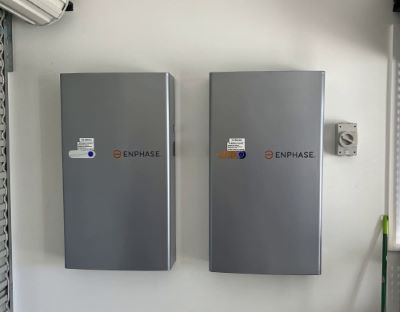
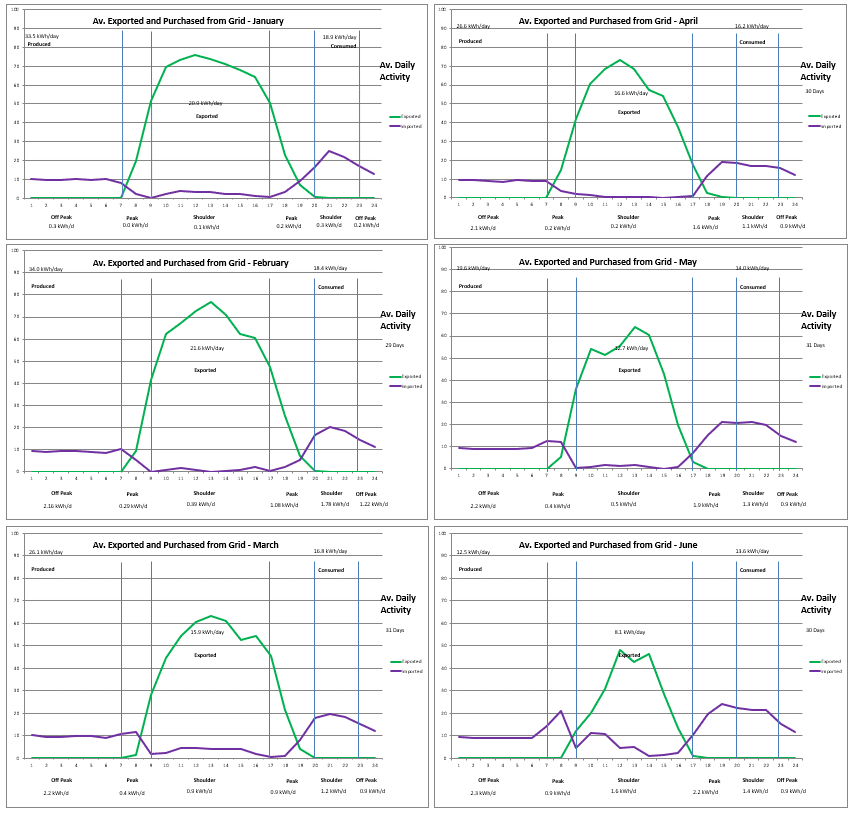
The following two graphs show the average daily energy values for each month of the year for a property that has evaporative cooling, a pool, gas heating and hot water, and has a 6.03 kW Enphase system installed.
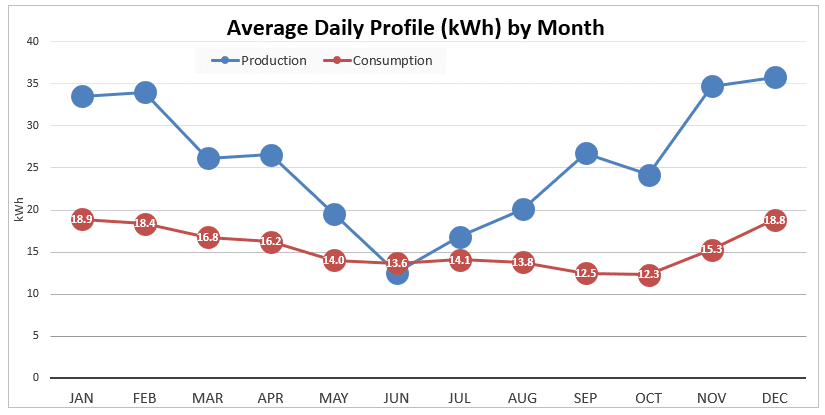
[ Consumption ] The red line – with the values shown – indicates that the average daily electricity consumption ranges from 13.6 to 18.9 kWh/day, with higher levels in the summer months due to the use of evaporative cooling and pool filtration. This represents total consumption and includes energy supplied by solar power and the grid.
[ Production ] The blue line indicates the average daily energy produced by the solar power system.
There is obvious seasonal variation in production output ranging from 35.8 kW/day in December down to 12.5kWh/day in June.
Note that the avg. daily output for January and February is lower than November and December. This is because January and February are generally hotter, and solar panel efficiency reduces as temperature rises (temperature coefficient).
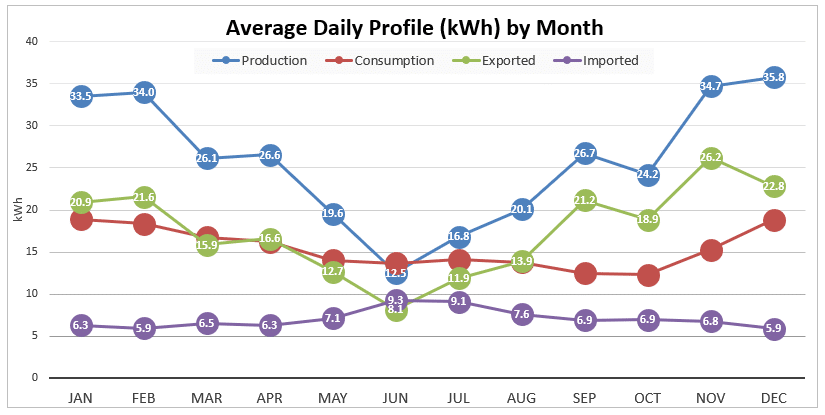
[ Exported ] The green line indicates the average daily energy exported (sold) to the grid, and tends to follow the shape of the blue production line. The exported energy ranges from 9.3kWh/day in June up to 26.2kWh/day in November for this example.
[ Imported ] The purple line represents the average daily energy purchased from the grid. This is comprised of electricity purchased from dusk to dawn, as well as during the days when cloud cover or rain reduces the solar production output. As would be expected, the level of imported energy rises during the winter months.
The seasonal differences that occur account for variations in what you see when the power bills arrive.
Subject to the system size and the energy plan you are on (i.e., whether with a high Feed-in Tariff (FIT) and minimal or no discount for energy purchased), the summer bills are more likely to be close to zero and the winter bills can be expected to have some payment required.
Generally, the calculations carried out to determine the system size required are based on average consumption rates (annually) as well as average peak sun hours for the location. Thus, winter production will fall short of generating sufficient solar energy to cover consumption requirements – more so with households that have reverse cycle heating.
If more solar production is required to cover winter consumption, additional panels can be installed to increase capacity which is easily done with an Enphase microinverter system. However, this will also lead to increased output potential in the summer months that may be curtailed if there is a grid export limit in place.
Seasonal variation can also have an impact on the viability of adding a battery (and/or an energy diverter for water heating). The storage capacity of the battery should be sized to match the level of energy exported as well as the energy imported.
For a ‘perfect’ scenario (i.e., to eliminate energy import), there must be sufficient available energy exported to fully charge a battery (ideally every day). Also, the stored energy capacity should be enough to cover the import requirements, so that the battery supplies the energy instead of the grid.
The evaluation also requires some knowledge about the time of day that electricity is consumed.
2. Average Daily Consumption Patterns
This graph shows the daily energy profile averaged over 365 days.
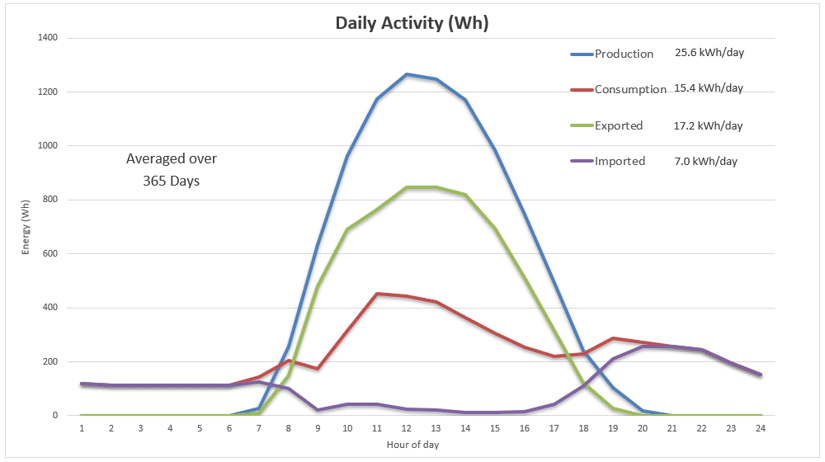
The red line (consumption – average 15.4 kWh/day) shows the times during the day that energy is consumed.
The highest usage during the day is when the pool pump is running (8hrs/day in summer, 2hrs/day in winter).
While there are fridges/freezers, TVs, computers, or other appliances on standby, there will always be a small level of energy consumption. For most households, other than operating a pool pump or air conditioning throughout the day, the period with the highest energy usage tends to be late afternoon/early evening.
The blue line indicates solar production, with an average of 25.6 kWh/day. On this property, the panels face NNE and NNW. If they were facing East and West only, the curve would be slightly flatter but wider.
The green line (exported) – average 17.3 kWh/day – indicates when energy export occurs and tends to follow the shape of the production curve. This exported portion of solar power output governs the income earned by the system, the extent of which depends on the Feed-In Tariff (FIT) offered by the energy retailer.
It is interesting to note that for this household a 5c difference in FIT is worth $315 per year – an important factor to consider when negotiating a new plan with the energy retailers.
The purple line (imported) – average 7.0 kWh/day – reflects the quantity of energy purchased from the retailer.
Going one step further, the data extracted from the Enphase system can also provide a detailed breakup on an hour-by-hour basis, as the following graph shows:
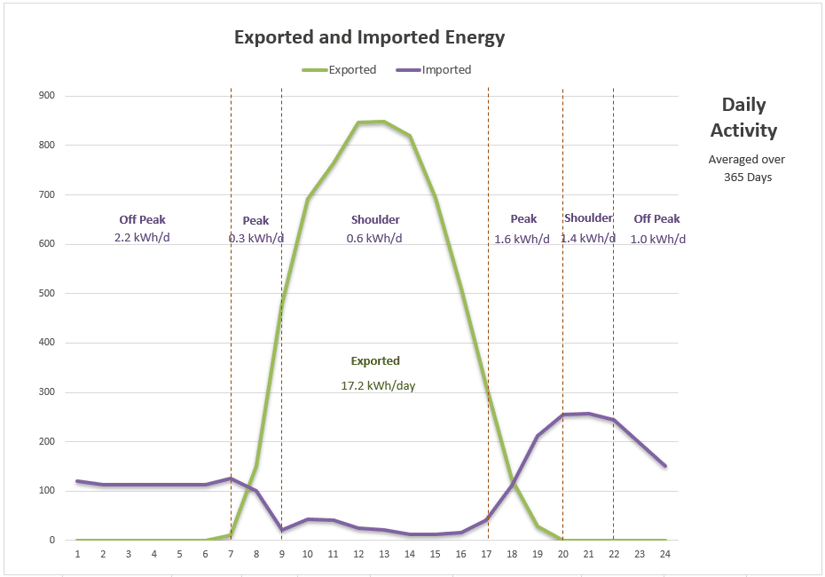
Armed with this imported energy pattern breakup, the various energy plans available from energy retailers can be evaluated in detail to provide the best plan option.
System Benefit Implications:
The income from exported energy is an easily understood benefit of solar power and can be seen on the power bill.
For this household, 17.3 kWh/day at $0.15 FIT represents a direct benefit of 17.3 x $0.15 x 365 = $947 per annum.
What the power bill doesn’t show is the energy produced by the system that is consumed directly by appliances.
In the household represented in the graphs, the energy offset benefit is the difference between the total consumption average (15.4 kWh/day) and the imported average (7.0 kWh/day) – i.e., 8.4 kWh/day.
Most of this saving is in shoulder time and a little in peak time – which for this household is around 36c per kWh.
Therefore, 8.4 x $0.36 x 365 = $1103 per annum.
Thus the total energy cost reduction for this household is $947 + $1103 = $2050 p/a.
3. Monthly Patterns of Usage
For most households, from month to month the daily patterns remain reasonably constant, with the major variation being the amount exported due to the seasonal effect, especially where gas heating and gas hot water is used.
In households that have reverse cycle heating and cooling, the pattern of usage often shows greater consumption during the day, often with greater peaks in the morning and late afternoon/evening, especially in winter.
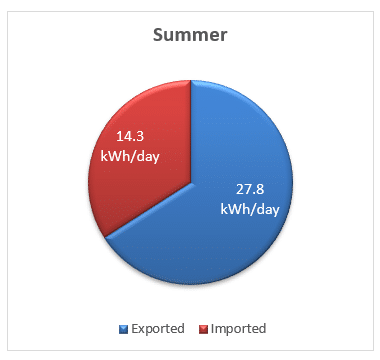
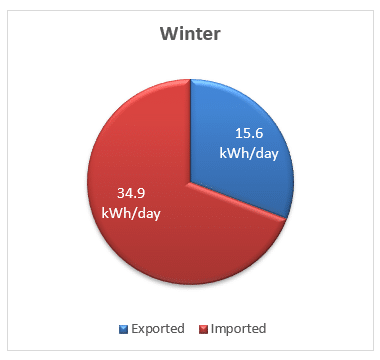
As can be seen in the two pie charts above, the variation in the ratio of exported & imported energy between summer and winter months can be quite substantial.
It is important to consider this seasonal variation when choosing an energy plan. You will want to have the most suitable balance between feed-in tariff and purchase discount.
Want More Information?
If you would like to know more about Enphase system monitoring, and how we can help with data analysis, give us a call or enter your details in the enquiry form below.
“At SolarWise Wagga our philosophy is simple, we aim to provide relevant and reliable information, quality service, and the highest grade of products at a competitive price.”